2024: Blog stats
I like the fact that Bryan Alexander did a blog retrospective for 2024, so I'm going to do something similar. I split my writing between three places: here, Thought Shrapnel and the WAO blog. For the former I've chosen my favourite posts as I don't collect statistics, and for the latter I've already published a round-up of the most popular posts of the year.
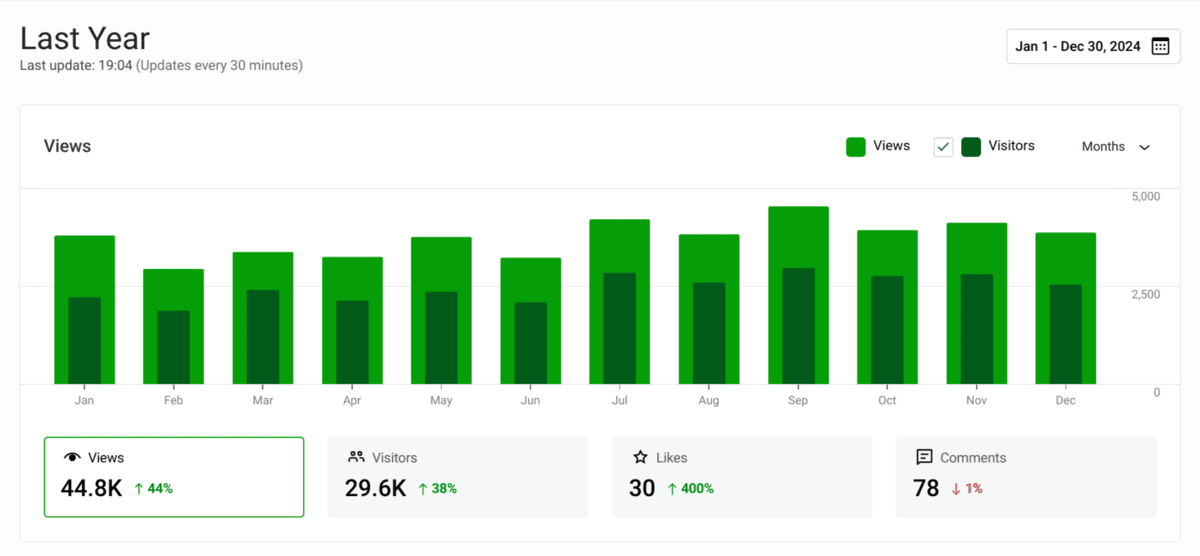
I published a weeknote every week of 2024 apart from the first and last couple of weeks. The category I posted in most, however, was MSc Systems Thinking. Overall, during the past 52 weeks, nearly 30,000 people viewed almost 45,000 pages on this blog.
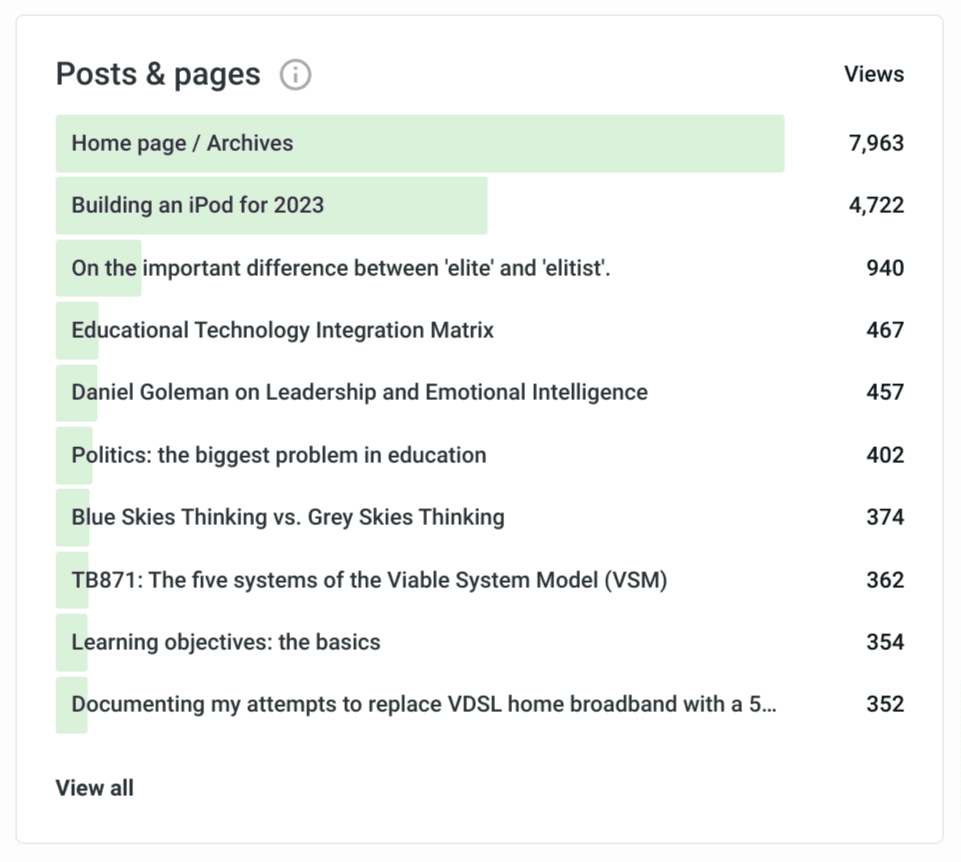
As you'd expect from a blog which is 18 years old (in its current incarnation) the most viewed content wasn't actually published this year. In fact, the only one in the top ten from the last 12 months was about the Viable System Model. I wouldn't have predicted that.
Currently, the easiest way to find any post is to use the archives. Perhaps I should make it easier to search the blog.
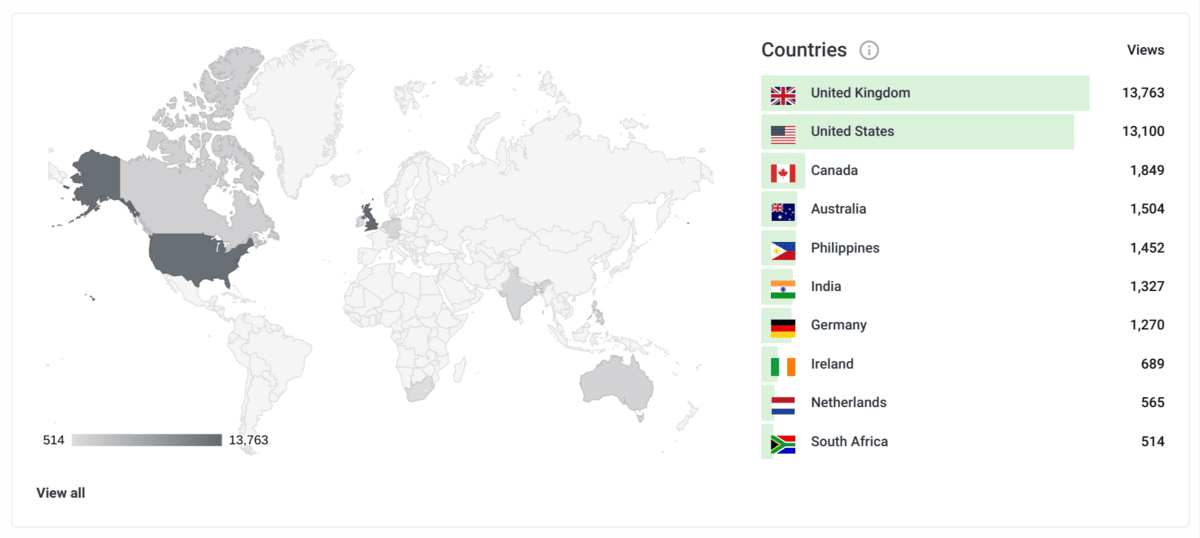
Visitors to this blog were, unsurprisingly from English-speaking countries, with views from the UK and US making up more than half of the total number.
I published 237 posts this year, writing a total of 176,138 words. That's the most number of words I've published here, but not the most number of separate posts. It's interesting to see how the comments have dropped off as social media has become the dominant way people interact and discuss each other's work.

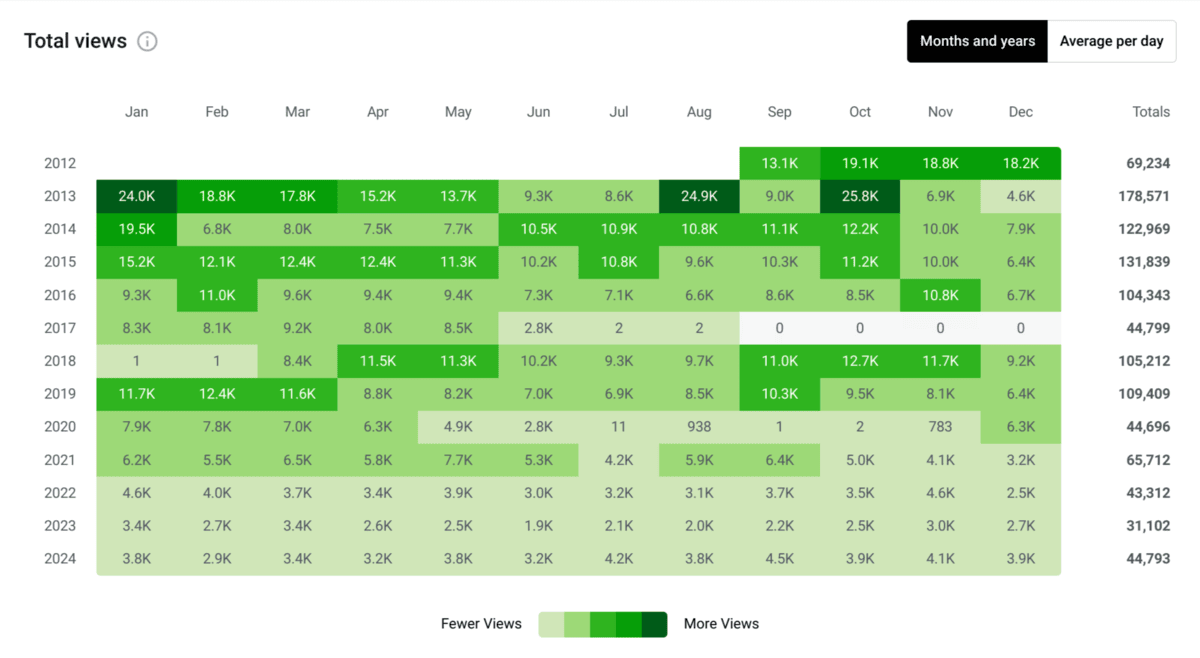
I used to blog quite consistently about things relating to edtech. These days, I'm writing about things which are probably more niche: my MSc in Systems Thinking, personal life, etc. There's also a lot more content out there in different formats. So it shouldn't be too much of a surprise that fewer people read what I publish these days than they used to.
(the data from June 2017 to February 2018 isn't available because I stopped using Jetpack for a while)
If you're a regular reader of this blog, thank you! What have you enjoyed me writing about this year? Is there anything you hope I write (more) about in 2025?